Whisker Robot
Whisker Robot | April-August 2023.
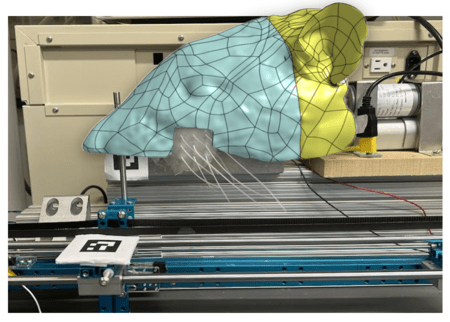
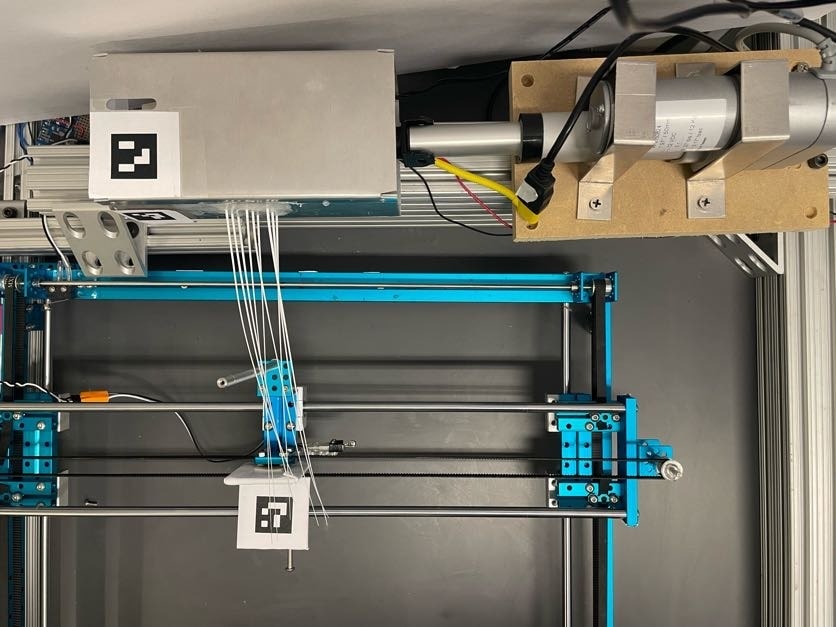
The Interior camera view is overlayed onto the top right corner of the Top Camera View.
The interior camera view is fed into an ML algorithm to determine the contact location of an object presented to the whiskers.
Motive
The main goal is to make the robot be able to tell the position (x-coordinate, y-coordinate)
of an object that is in contact with the whiskers of the Robot. This is inspired by how rats perceive
information about their surrounding environment with the help of their whiskers.
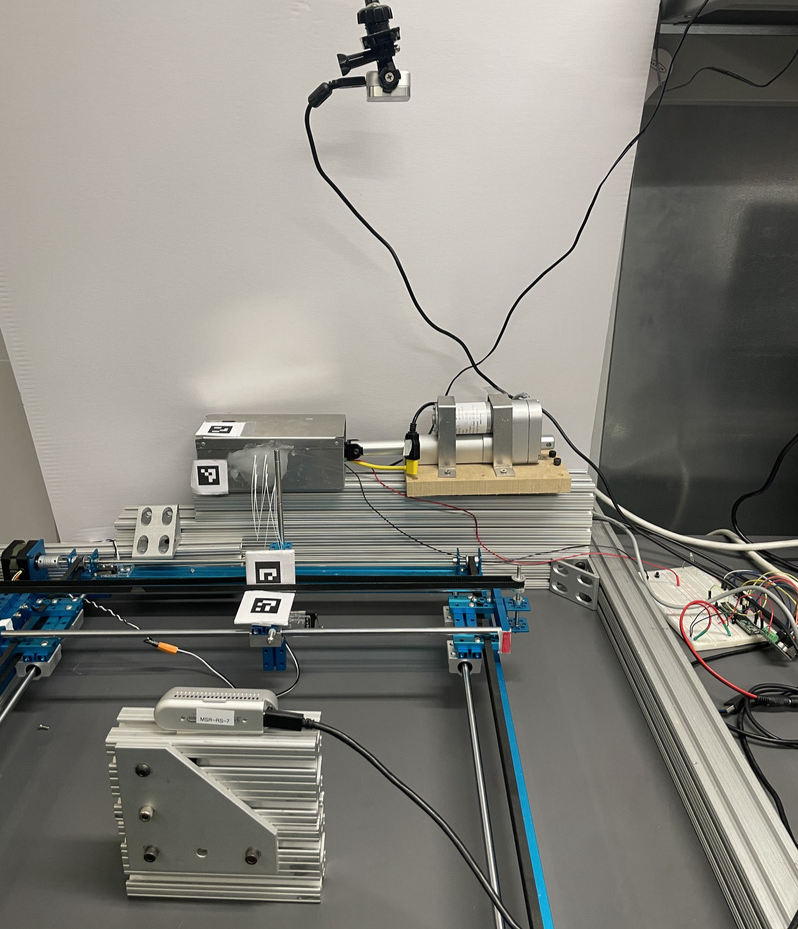
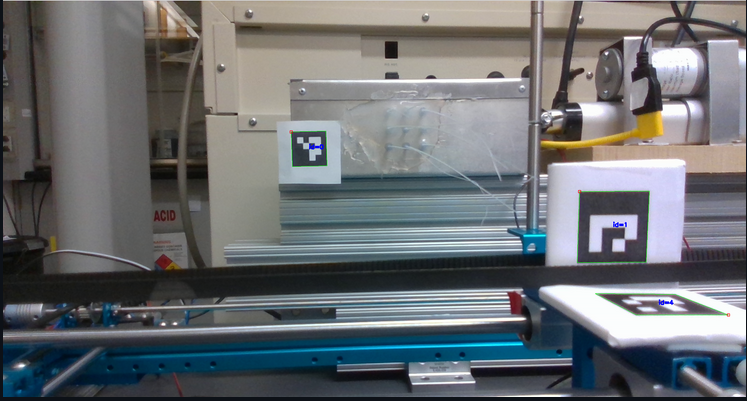
Hardware Setup
There is a Whisker Robot, and an xy-plotter, both enclosed within an arena. They are actually clamped
to the table to avoid any movement of either the Whisker Robot or the xy-plotter setup. There is a
top camera, obtaining the top view of the hardware setup, a front-camera obtaining a front-view of the
Whisker Robot and the object that is made to contact the whiskers, then there is an interior camera
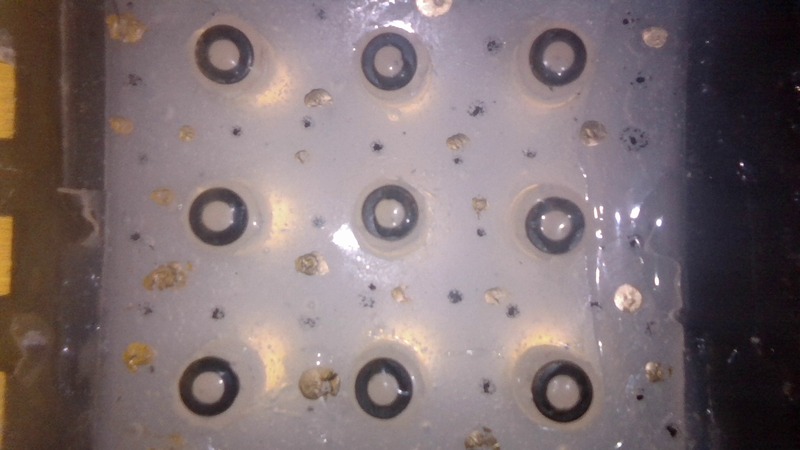
mounted inside the Whisker Robot which captures images of the membrane which is attatched to the whiskers.
This membrane changes with changes in the position of any of the 9 whiskers of the whisker array.
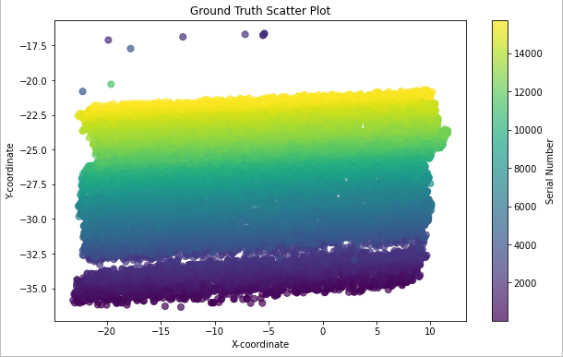
Automatic Data Collection
I designed an automatic data collection system. An aruco marker is placed on the Whisker Robot which is stationary,
and another aruco marker on the part of the xy-plotter that moves along with the object the same magnitude and in
the same direction. Therefore, using these two aruco markers which is read from the top camera, the object position
relative to the Whisker Robot is acquired/calculated. The object is moved by a step size of two units (approximately 0.89mm)
according to the xy-plotter in the direction that is across (perpendicular) to the whisker array and by a step size of two units
according to the xy-plotter (equivalent to approximately 0.66mm) in the direction along (parallel) to the whisker array.
It is important to note that the xy-plotter is not a perfect square hence the difference in the step size value across x and y.
After completing to traverse the entire breadth of the xy-plotter through mutliple steps, the object is moved a step parallel
to the whisker array and this process continues until it reaches the start (0,0) point of the xy plotter which is the closest
possible to the Whisker Robot along the direction parallel to the whisker array.
Data Preprocessing
- Correlate interior camera membrane images with coordinate information of the object based on Serial no.
- Remove NaN/missing values
- One hot encoding, specifically Label Encoder for direction (left and right in words to 0 and 1)
- Remove outliers or suspicious(since contact and non-contact range is decided manually, there is a time when the object(vertical peg) in this case is close to the whisker but not in contact) data during training the model(outlier detection)
- In the model for classification of contact and non-contact there is some additional pre-processing required.
- The classes were unbalanced, i.e. the non-contact datasamples was around 7800 whereas the contact datasamples was around 1600. Since all the non-contact membrane images are exactly the same, there wouldn't be loss of information by reducing the non-contact datasamples, the non-contact datasamples were downsampled and made equal to the number of contact datasamples.
- Performed stratified split to ensure there is a percentage of each class in the same ratio in both train and test dataset.
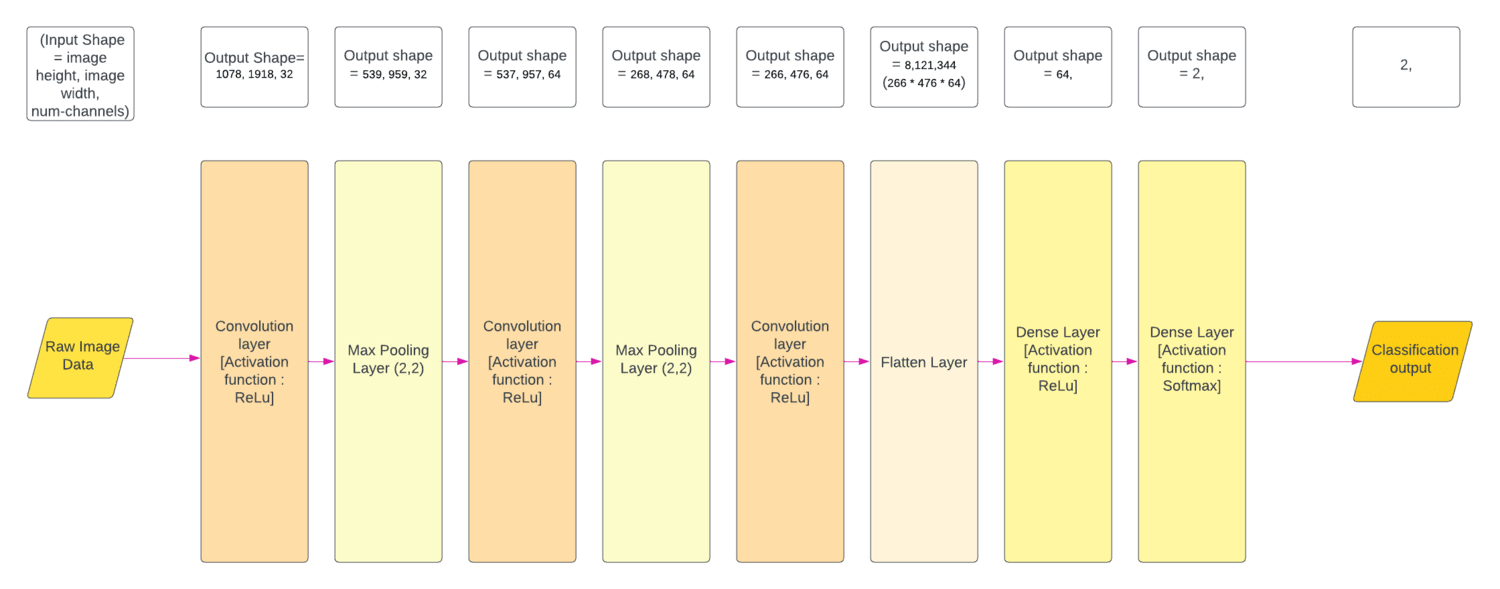
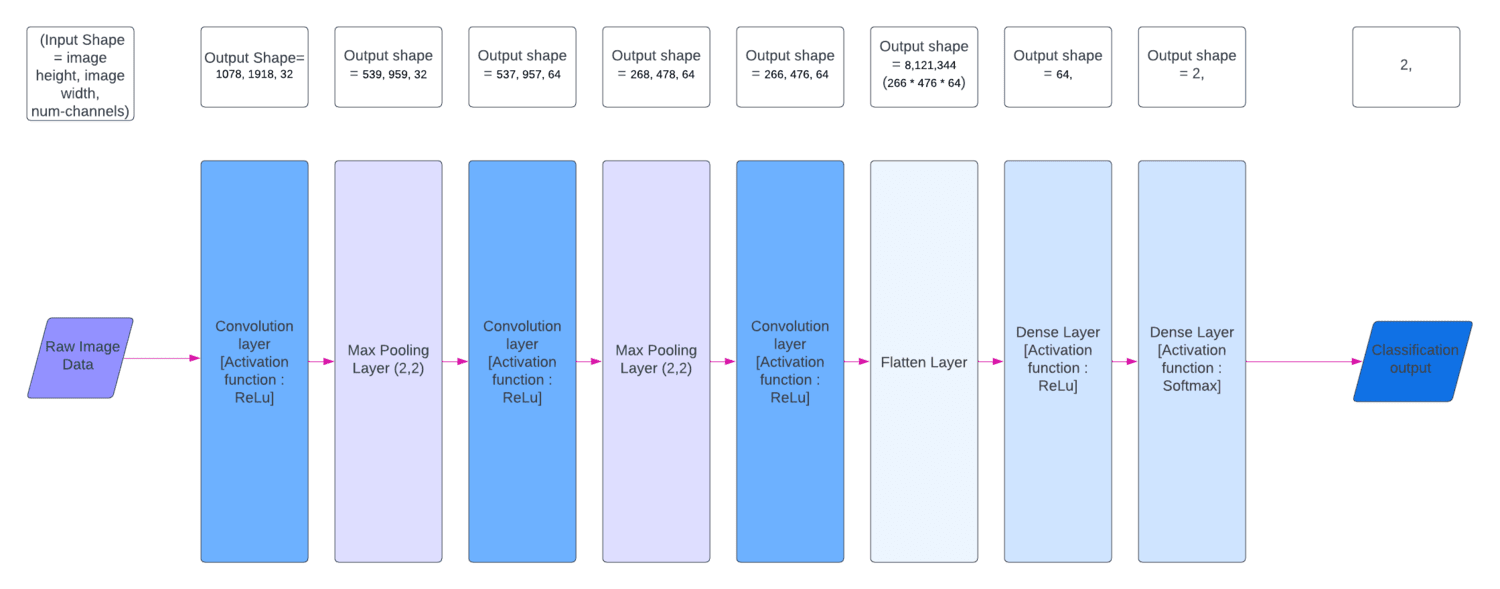
Machine Learning Algorithm
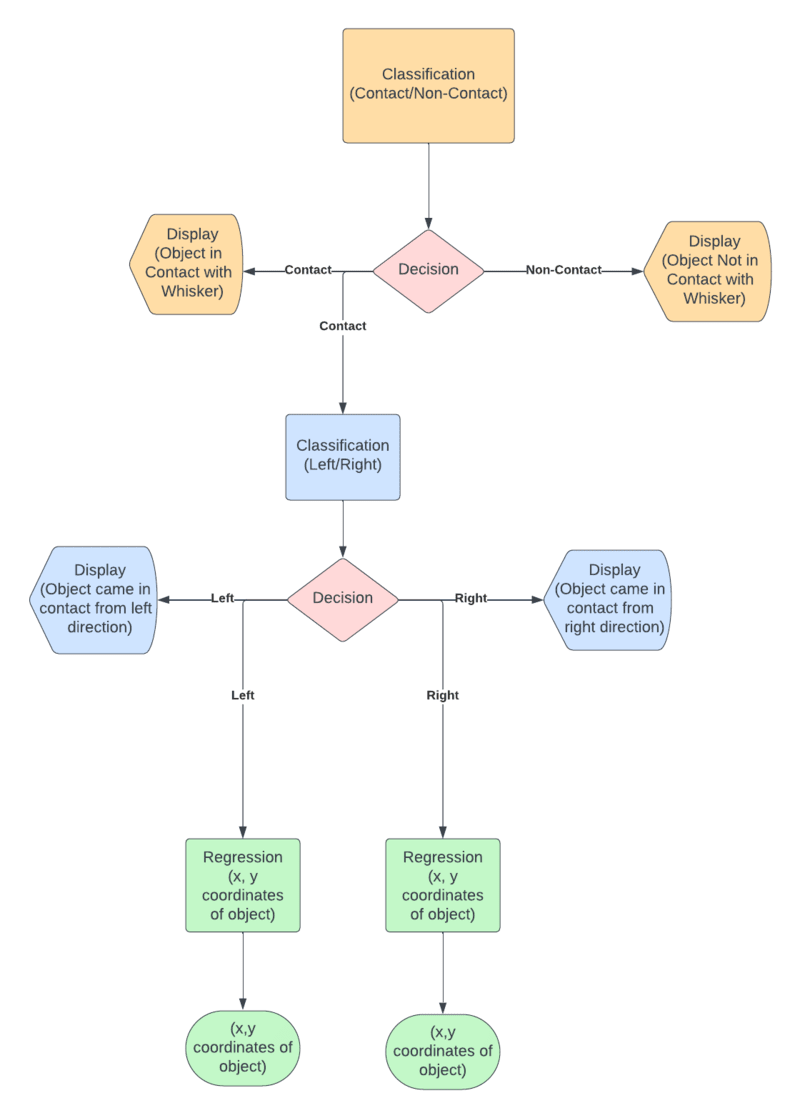
A neural network is first used to perform a classification task i.e. to classify that the membrane
image corresponds to that when there is or isn't contact of the object to any of the whiskers.
Another neural network is then incorporated to classify if the membrane image corresponds to that
when the object has approached the whisker array from the left direction or from the right direction,
only after it has classified that the image is for a object-whisker contact point.
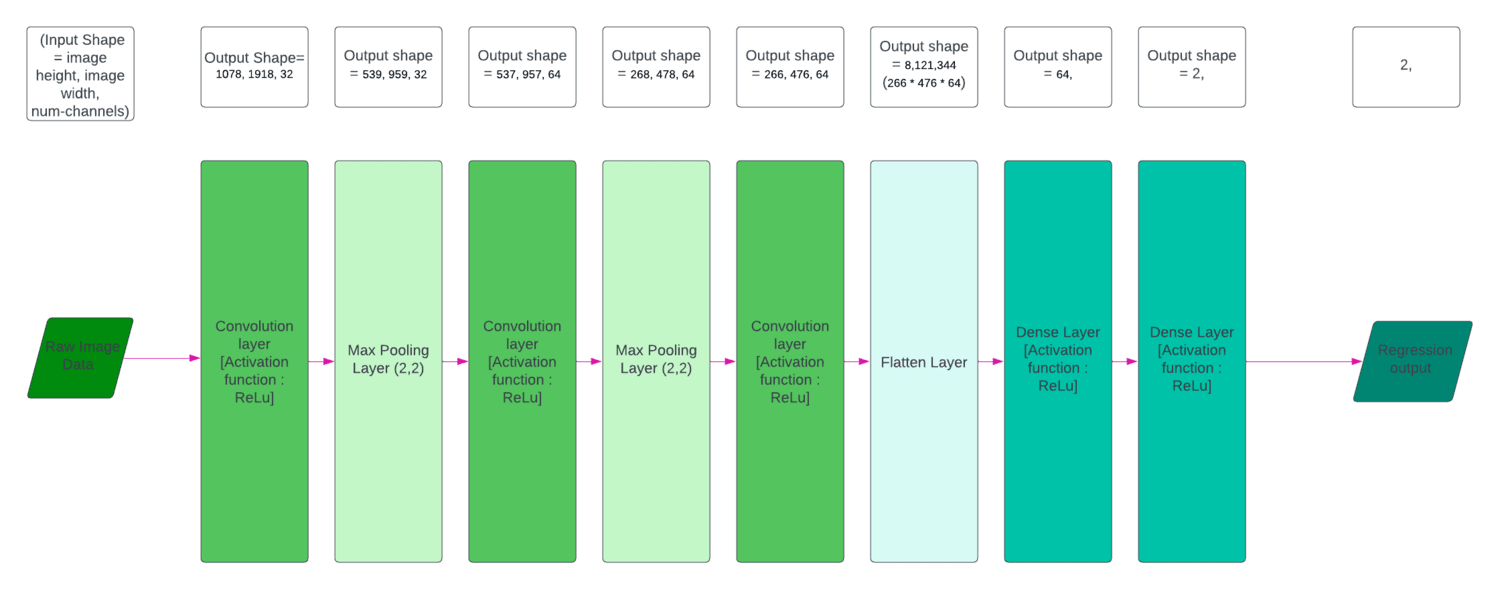
Thereafter, it is noteworthy that a separate neural network performs the regression task of predicting
the x and y coordinates of the object that came in contact with the whisker array for each the left
direction and right direction contact point. This entire structure is depicted through the flow chart above.
Neural Network Structure:
The colvolution layers extracts features from the input image using filters or weights/matrices
which are like a sliding window being multiplied with the input pixels. From the convolution
layers we obtain feature maps. The MaxPooling layer results in a downsampling picking up only
the important features. In this case I have used a Max-Pooling layer with pool size (2,2),
The flatten layer is primary responsible for vectorization into a 1D (one-dimension),
for feature aggregation by forming a comprehensive set of features, and to aid in transition
into fully connected layers.
Fully Connected layers, also known as Dense layers, is responsible for end to end learning,
used for decision-making and final predictions. It is connected to all th neurons of the previous layer.
Here, the model learns more abstract features from the input image.
Hyperparameter tuning like experimenting with the learning rate,number of layers, number of filters in each layer,
using batch normalization, using regularization, using dropout layers can be done to try to achieve improved results.
Below are the detailed diagram of each of the model architectures that constitute the multimodal algorithm:
Each of the models was trained and tested on full resolution images (1080,1920,3). A Total of 15,710 data samples is
collected via the automatic data collection system. After removing NaN values and suspicious data, there is 9137 data samples
remaining. Since x,y coordinate approximate ranges for contact and non-contact is decided manually, it isn't perfectly accurate.
Suspicious data is the data sample for those ranges when the object is close to the whisker but not in contact, or just touching
the whisker but has not moved the whisker causing any change in the membrane that isn't negligible.After geting rid of this
untrustworthy data, a significant improvement in results was observed in the x-coordinate and y-coordinate prediction results in
the regression model.
Results
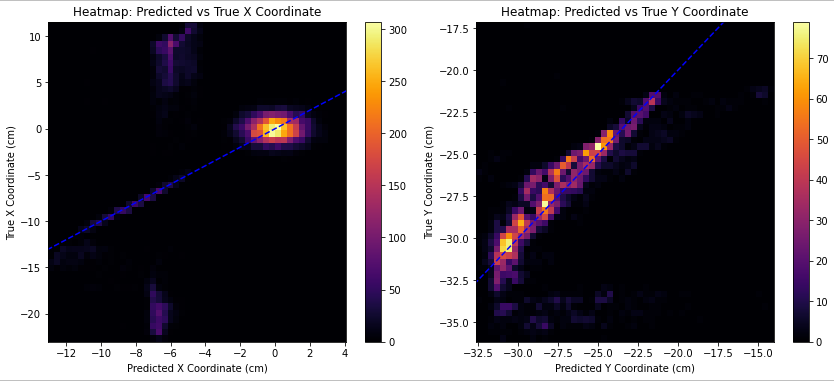
In an ideal scenario, all the data points would be on the blue dashed line.
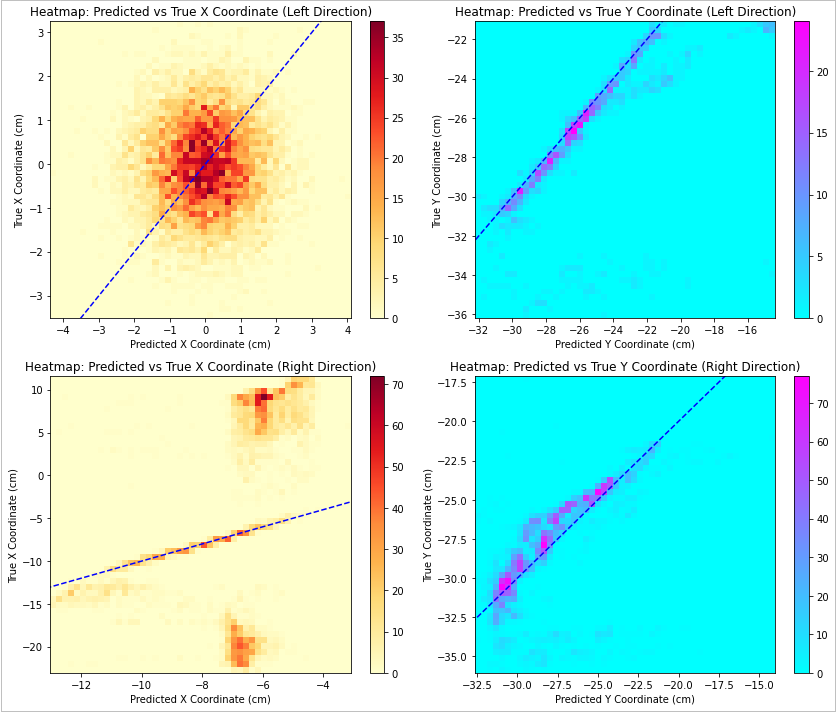
In an ideal scenario, all the data points would be on the blue dashed line.
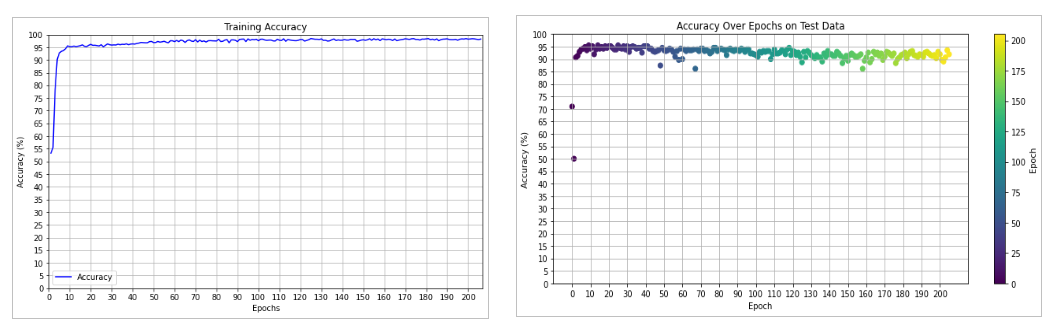
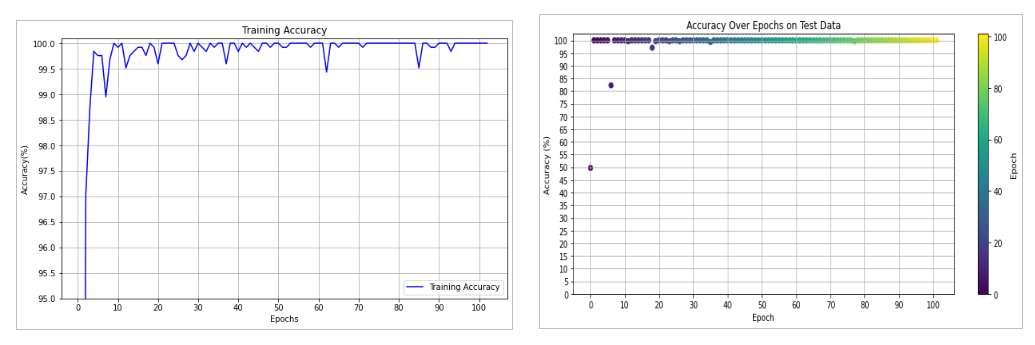
Accuracy
Accuracy(%) = (N_total/N_correct)*100
N_correct --> number of samples that were correctly classified.
N_total --> total number of samples in the dataset.
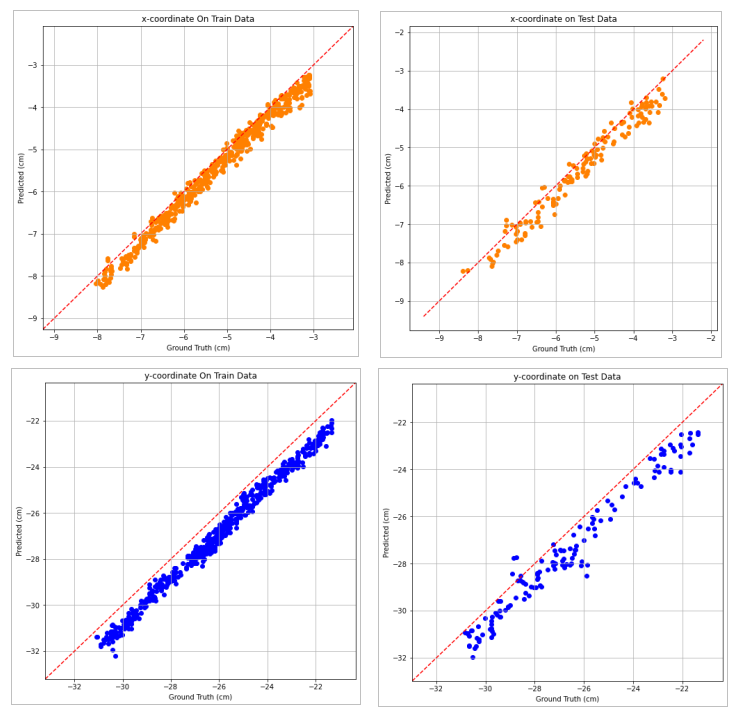
For an ideal model all of the data points would lie on the dashed red line
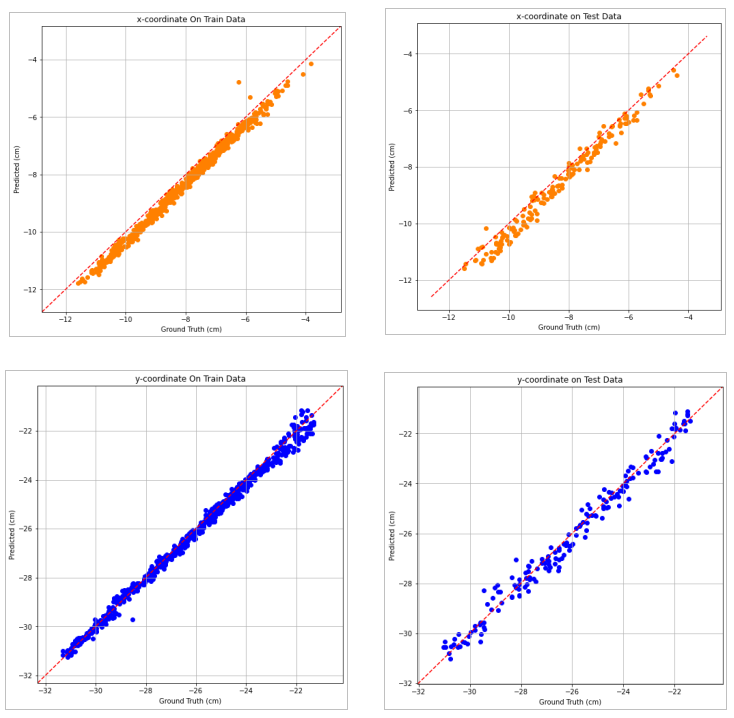
For an ideal model all of the data points would lie on the dashed red line
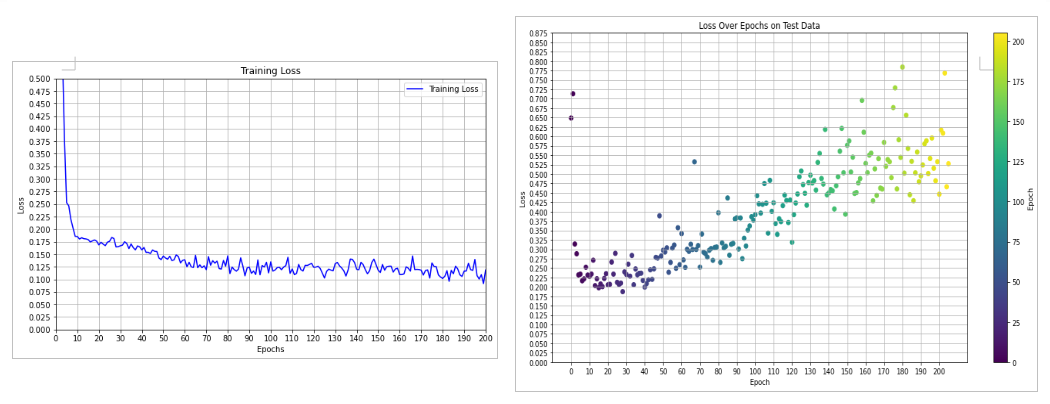
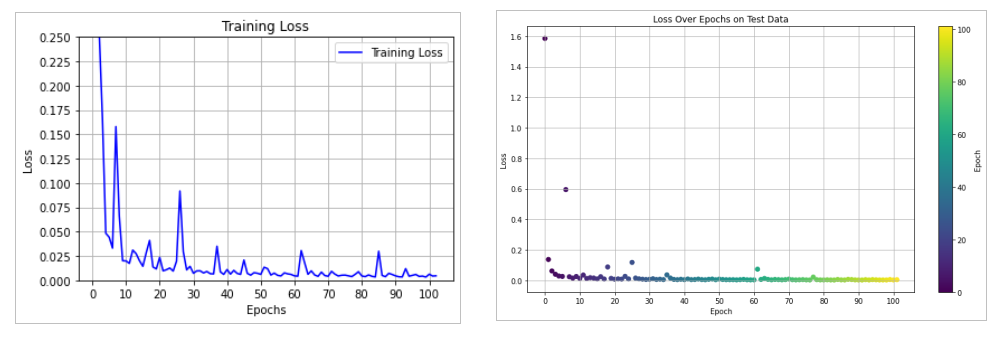
Loss
In the classification models I used categorical coss-entropy function to calculate the loss
as the in classification there is a class (discrete value) prediction with a confidence level
or in other words probability of each of the classes it is trained on.
Whereas, in the regression model the loss function that is used here is mean squared error (MSE).
In regression, a continous value prediction is made.
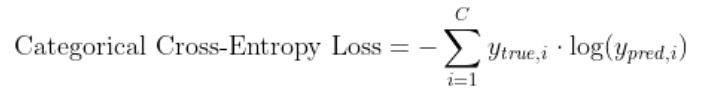
C = number of classes
y_true,i = true value or ground truth
y_pred,i= predicted value
This formula calculates the negative log-likelihood of the true class label under the predicted class probabilities.
The goal is to minimize this loss during training.
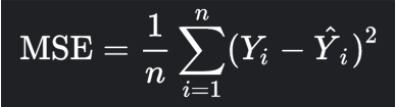
n = number of data points
Y_i = true value or ground truth
Yhat_i = predicted value
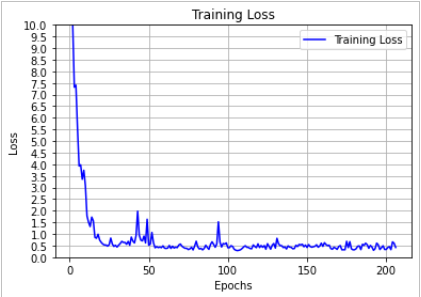
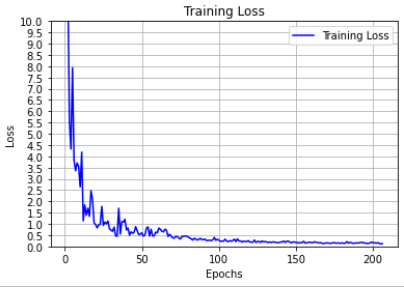
MSE achieved on test data after 206 epochs for the regression model trained on only contact data, and only
for left direction was = 0.48461 cm^2
MSE achieved on test data after 206 epochs for the regression model trained on only contact data, and only
for right direction was = 0.14036 cm^2
Code
Future Scope
The future scope of this project is to obtain not just a 2D perspective (x,y coordinates) of the object but the 3D perspective (x,y and z coordinates) of the points of contact of object to the whisker. To further elaborate this, the objective is to obtain a point cloud of all the contact points (9 contact points) of object to the whisker, thereby better enabling to reconstruct the object that came in contact with the whisker of the Whisker Robot through whisking.
Acknowledgements
Dr. Mitra Hartmann (Principle Investigator at SeNSE LAB)
Mr. Kevin James Kleczka (Research Engineer at SeNSE LAB)
Professor Matthew Elwin (Co-Director of MS in Robotics program)